The Snowball Effect: Exploring Exponential Growth
How recognizing rapid growth patterns can transform decision-making and strategy
The Civilization franchise released its seventh installment this week.
While I enjoy many games, strategy titles like Civilization capture my love for creative problem-solving.
Civilization is part of the 4X subgenre of strategy games. 4X is named for its core pillars: Explore, Expand, Exploit, and Exterminate. You start small and gradually build an empire to meet specific victory conditions. Success depends on efficient resource management, technological upgrades, and continuous growth.
Although every game of Civilization unfolds uniquely, they tend to follow a familiar pattern. The early stages are measured and deliberate, with only a handful of units on the map, making each decision more impactful. With success, you hit a mid-game inflection point when established cities generate additional resources that power a self-reinforcing growth cycle, propelling you toward the end-game.
The franchise’s previous installment, Civilization 6, included a victory screen with a graph that tracked various metrics throughout the game, such as the number of cities, total units, and game score. Below, I’ve included a screenshot of one of these screens, which plots the score on the y-axis and the turn number on the x-axis. Each line represents a player in the game.
Look closely at the gold line that tracks the player who chose Mansa Musa. You can clearly see the inflection point. Notice how, in the first half of the game, all players are relatively close to one another. But around turn 80, the gold line pulls away from the others. By the end of the game, that player’s score was nearly double that of his nearest competitor.
This phenomenon is well-known in the video game world and is referred to by gamers as snowballing. The metaphor is of a snowball rolling down a hill. Initially, the snowball is small, moves slowly, and requires much effort to continue gaining momentum. As it travels, it accumulates more snow, growing larger and picking up speed. As the snowball continues to grow, it becomes more challenging to stop.
Video game developers find this concept challenging to address. Players can feel when that inflection point hits. It becomes difficult to catch up once someone starts snowballing and pulling away. Although much of the game remains, the outcome is unlikely to change unless something significant alters the circumstances.
Snowballing is not limited to video games. The principle shapes everything from technology to our daily lives. It’s known as exponential growth.
I often think about exponential growth. Once you are aware of it, you can see it everywhere. Making good decisions when it’s present requires understanding how it works. In this post, I will explore the concept in more detail, outlining what it is, where it exists, how to spot it, and ways to take advantage of (or avoid being burned by) it.
What is Exponential Growth?
There’s an old fable about the invention of chess that demonstrates the concept of exponential growth.
As the story goes, a peasant invented the game of chess and introduced it to a kingdom. The king was delighted and granted the peasant his choice of a reward. The peasant had a peculiar request: he wanted one grain of rice placed on the 1st square of the chessboard, two grains on the 2nd, four grains on the 3rd, and so on, with the number of rice grains doubling on each of the 64 squares on the board. The king was baffled by this seemingly meager request and immediately agreed, ordering his subjects to deliver the rice to the peasant.
The king’s men placed the rice grains on the squares in the first row. One grain was placed on the 1st square, two on the 2nd, and so on, up to 128 grains on the 8th.
Continuing to the second row, they put 256 grains on the 9th square, 512 grains on the 10th, and so on until they counted 32,768 grains (approximately one kilogram) for the 16th square. The rice was too challenging to count by grain, so they were forced to start weighing each load.
On the third row, they placed 2 kilograms of rice on the first square and continued to the end, weighing 256 kilograms of rice for the last. The situation became dire on the fourth row when, by the end of the row, 65,536 kg, or approximately 72 tons of rice were required. The total needed for the 32nd square was more rice than what existed in the entire kingdom, and half of the chessboard still remained.
It’s good that the king had unmitigated power and could easily renegotiate the peasant’s prize (some kings in history may not have been so kind to the peasant for tricking him). Still, the king learned a valuable lesson about exponential growth. Small numbers can grow large very quickly — much faster than we realize.
The king shouldn’t feel bad for not understanding this concept. Humans today are not much better at conceptualizing it. University of Colorado physics professor Albert Allen Bartlett once said, “The greatest shortcoming of the human race is our inability to understand the exponential function.”
Exponential growth exists when a quantity increases by a constant factor over equal time intervals. The following equation can represent its general formula:
a is equal to the initial amount, r is equal to the growth rate, and x is equal to the number of time intervals
For our example above, a represents our starting point on the first square of 1; r represents the growth rate, which is 100% for doubling, or 1; and x represents the position of the square relative to the starting point (i.e., at square 8, x = 7 because square 8 is seven places ahead of our starting point, square 1).
The values of a and r are constant for our problem, so we can simplify the equation to determine the number of rice grains on any individual square:
While the total is small in the first row with the final value on square 8 (x = 7) of 2⁷ or 128, it’s astronomically large on the final row at square 64 (x = 63) of 2⁶³ 9,223,372,036,854,775,808. If you’re curious, that number is nine quintillion.
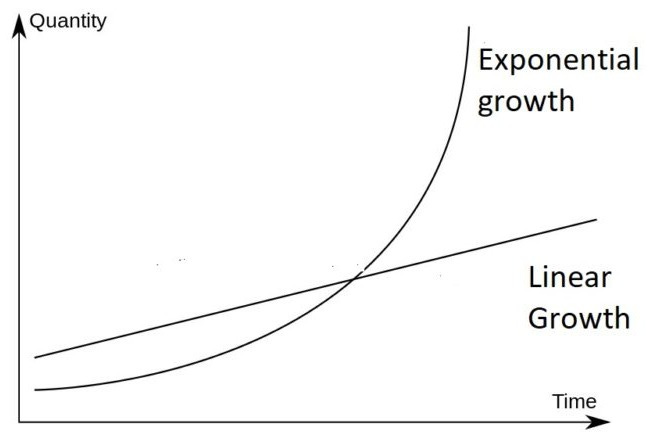
Sometimes, it helps to visualize this concept. The graph below shows two lines — one exponential and one linear. The exponential line starts with a flatter growth rate, similar to the linear line. However, as it moves further along the x-axis, the quantity of the exponential curve grows more rapidly. Before long, the line looks vertical, especially compared to the constant increase of the linear line.
Exponential Growth in Everyday Life
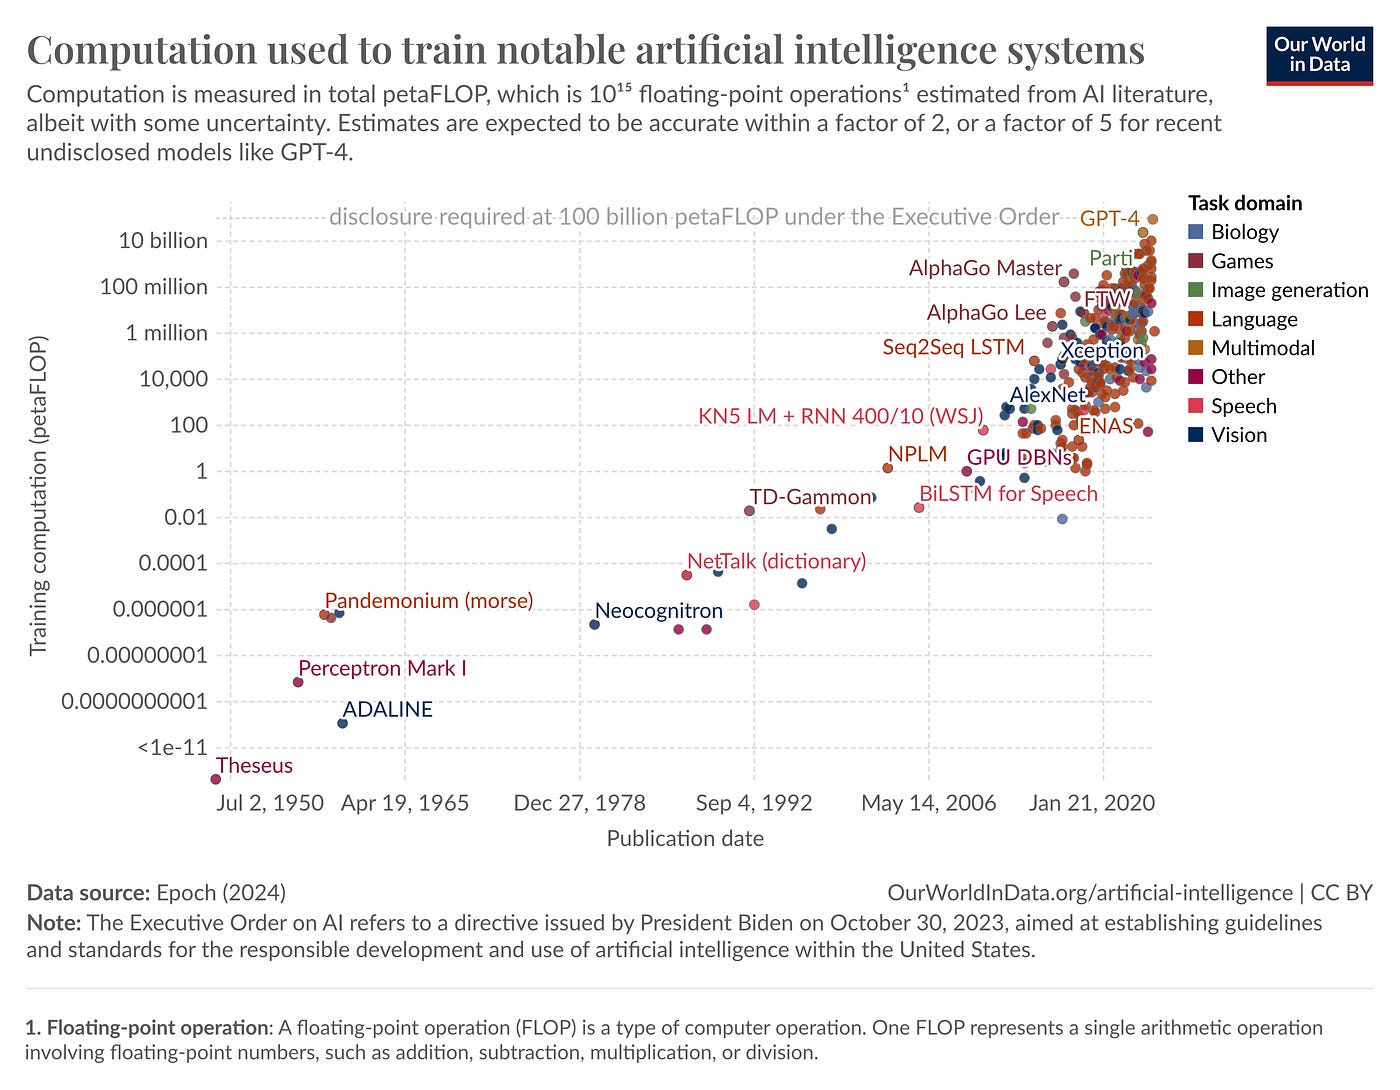
Exponential growth exists in many sectors. The obvious and most prominent one is in AI. At least, it certainly feels like we’re in it. I’m not just talking about the vibes from Sam Altman, Jensen Huang, or anyone else in the tech community. Much of the data available about investment, use cases, adoption, and model performance lend credence to the idea that the AI space is growing exponentially.
One of the most relevant examples of exponential growth is found in finance — specifically, in the power of compound interest. Einstein famously remarked, “Compound interest is the 8th wonder of the world.” Since the Great Depression, the S&P 500 has averaged an annual return of around 10%. At this rate, a $1,000 investment in an S&P 500 index fund, compounded over 40 years, would grow to more than $45,000. It’s no wonder experts urge you to start investing early. The compounding effect can transform modest sums into substantial nest eggs over time.
We see exponential growth in nature. In optimal conditions, animals like deer or rabbits can reproduce quickly. If each pair of animals produces several offspring each breeding season, and those offspring quickly mature to reproduce, the number of animals can skyrocket.
Finally, we just experienced an example of exponential growth in the spread of viruses during the COVID-19 pandemic. When the virus started taking root in early 2020, case counts were relatively small. On average, each infected person spreads the virus to multiple people. This initial growth was exponential — the rate of spread per person was greater than 1. The term “flatten the curve” described measures such as social distancing or masks to slow the virus’s growth rate, ideally turning the exponential curve into a logistic one (more below).
Recognizing Exponential Growth
Exponential growth is challenging to recognize when you’re in the middle of it. In the short term, growth can look linear, particularly when you don’t have many data points. Our brains are wired to interpret change in linear terms, so the subtle early increases in an exponential trend often go unnoticed until the curve sharply accelerates. However, there are some ways in which you can learn to spot this phenomenon.
The first is by recognizing a doubling effect. An exponential curve will grow at a relatively constant rate, meaning that the time a value takes to double will be constant over time. If something takes 10 days to double from one to two, we would expect the value to be four approximately 10 days later. If you see this constant doubling occur, you might be in exponential growth.
We can see this doubling effect when looking at COVID-19 cases. The graph below plots case counts within the United States during the first half of March 2020. On March 1, there were only 75 reported cases. Three days later, that total doubled to 158. Two more days after that, it doubled again to 319. This pattern continued, with case counts doubling every two to three days. With the knowledge of exponential trends in mind, it’s easier to understand why some experts raised flags about the spread of the virus early despite small early case counts.
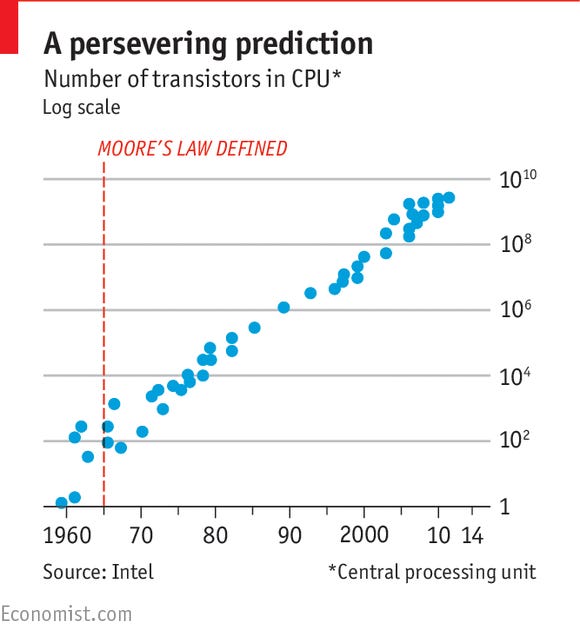
Graphs can also help to recognize exponential growth. One trick is to use a logarithmic scale. This method alters the y-axis so that equal distances represent equal multiplicative factors. It is ideal for visualizing data that spans several orders of magnitude. Under this scale, an exponential graph will appear linear.
One of the most well-known examples of exponential growth is Moore’s Law. Proposed by Intel cofounder Gordon Moore in 1965, Moore observed that the number of transistors on a microchip doubled approximately every two years, a driving force behind the advancements in technology that have enabled more powerful, efficient, and complex devices with each generation.
Below, Moore’s Law is graphed on a logarithmic scale. Notice the clear linear trend in the growth of the number of transistors. One of the most impressive aspects of Moore’s Law was his ability to recognize it so early with only a few data points.
Limitations of Exponential Growth
Recognizing that exponential growth cannot continue indefinitely in the real world is essential. Finite constraints limit most systems. For example, a population might initially grow exponentially, but as factors like food, water, and living space become limited, the environment imposes a natural ceiling on growth.
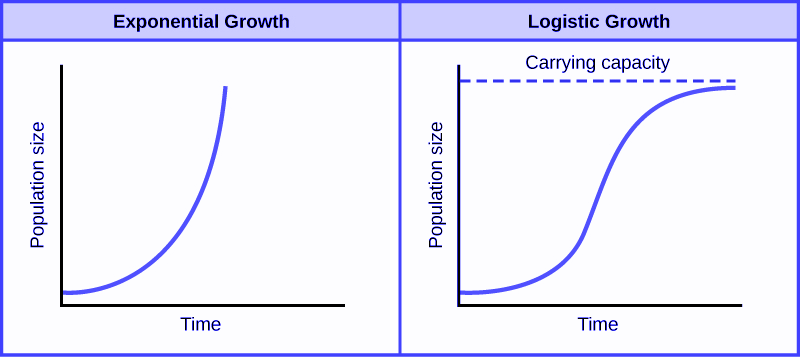
Logistic growth models describe systems that start with rapid, exponential growth but gradually slow down as they approach these limits. As this transition happens, the exponential growth slows and eventually reaches equilibrium, as noted in the graph below by the “carrying capacity” line.
The logistic curve’s characteristic “S” shape provides a more accurate picture of how growth evolves when resources, energy, or space impose practical constraints.
A lesson from this is not to over-extrapolate early exponential trends far into the future. While exponential models can offer valuable insights into the initial phases of growth — often capturing the excitement of rapid change — ignoring the subsequent shift toward saturation can lead to unrealistic expectations and potentially poor strategies. This cautionary approach is particularly relevant in financial forecasting or resource management, where decisions based on overestimated growth trajectories can have significant and costly consequences.
Consequences of Exponential Growth
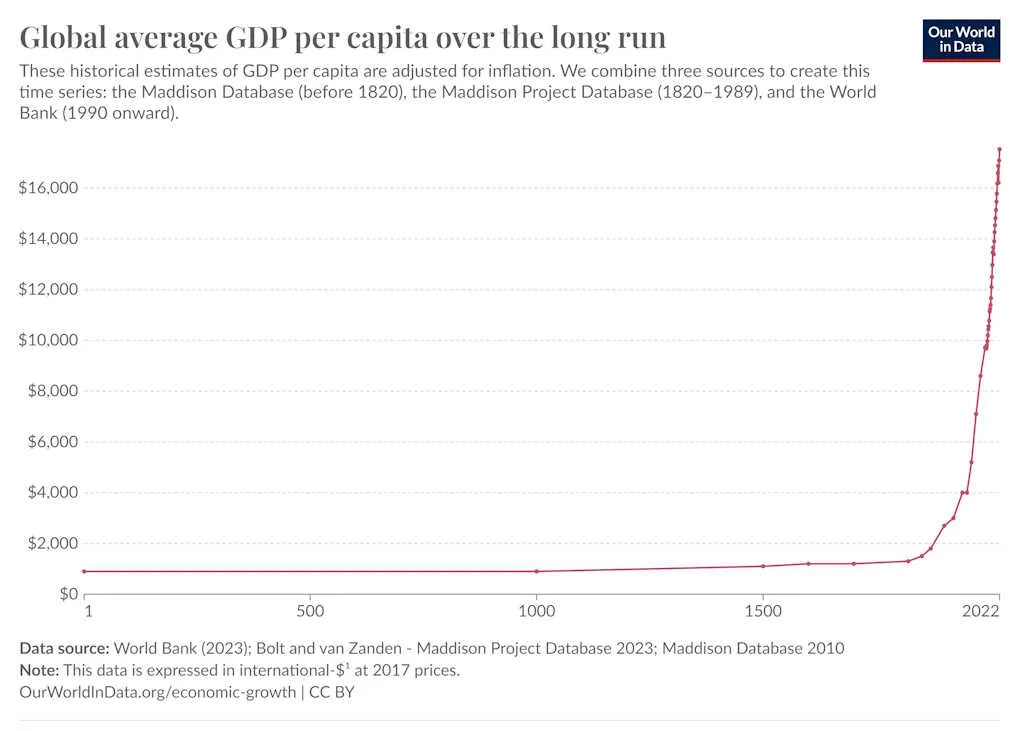
One of my favorite examples of an exponential graph is the one below, which plots the historical average GDP per capita. GDP stands for gross domestic product and is used to represent economic growth.
GDP growth is a good thing for the world. In 1820, 88% of the world’s population lived in poverty. Two hundred years later, that number is down to 9%. Improvements in technology and productivity mean that the average person lives a far better life today than they did 200 years ago.
Nevertheless, rapid growth has profoundly transformed our society. One hundred fifty years ago, over half of the U.S. workforce was employed in agriculture; today, that number has shrunk to about 1%, thanks to technological advances that allow fewer workers to meet farming demands. Yet while many people successfully transitioned to new industries, a significant number struggled to adapt, with some facing life-altering hardships.
Exponential growth often manifests in financial markets, sometimes culminating in dramatic bubbles. One of the most famous historical examples is the Tulip Mania in the Dutch Republic during the 1600s. During this period, tulip prices soared to extraordinary levels before collapsing in 1637. At the peak of the craze, individual tulip bulbs were selling for more than ten times the annual income of a skilled artisan.
Tulip Mania is frequently cited as the first recorded speculative bubble, yet similar patterns have recurred throughout history. In the past 25 years alone, we’ve seen the dot-com bubble in the early 2000s, the housing crisis in 2008, and multiple volatile booms and busts in the cryptocurrency market. In each case, asset prices escalated rapidly, creating enormous wealth for some who managed to sell early — whether through astute strategy or dumb luck. Many others unfortunately suffered significant financial losses, sometimes even losing their life savings when the bubbles burst.
Decision-making is critical when small changes can snowball into massive effects. A long-term view is essential. Failing to anticipate rapid growth can lead to missed opportunities or unsustainable practices.
Recognizing exponential growth requires a shift from traditional linear thinking, which often underestimates both speed and scale. Embracing this exponential perspective reveals immense potential for breakthroughs while reminding us that unlimited expansion is unsustainable. By adopting an exponential mindset, you can balance ambition with realistic, long-term planning.
Conclusion
If it feels as if things are changing more quickly, it’s because they are. That’s the way exponential growth works. The world transformed more significantly between 2000 and 2025 than between 1975 and 2000. And I think it’s a safe bet that it will change even more rapidly in the next 25 years.
Understanding this concept will help you better recognize it in data, equipping you with the necessary knowledge to react to it. Sometimes, that might be through making sound investment decisions. Other times, it might help you prepare effectively for a pandemic. Either way, you’ll be more ready to assess and react to whatever life throws at you with the correct information.
Take a look at exponential trends in your own lives. Or in your day-to-day work. Once you see the world through this lens, you’ll see examples everywhere.
Just as I jump back into Civilization 7 to play with its exponential mechanics in action, I invite you to look for these patterns in your world and harness them to make better decisions.
Thanks for reading. In case you didn’t notice, I’ve updated the title of this newsletter to Complexity Simplified. While the specific topics of essays will vary, I plan to write about topics that align with the general vision I wrote about last year:
My professional vision is to help others understand complex ideas. To look at problems through the lens of frameworks and logic. To share ways of thinking strategically. To share the wisdom I’ve learned over the years that has helped me to navigate through life.
You can read more about those topics here. I publish new essays approximately twice monthly.
Please leave a comment below if you have any thoughts or feedback. I’ll be back with another essay before the end of the month.
All the best,
Lukich


